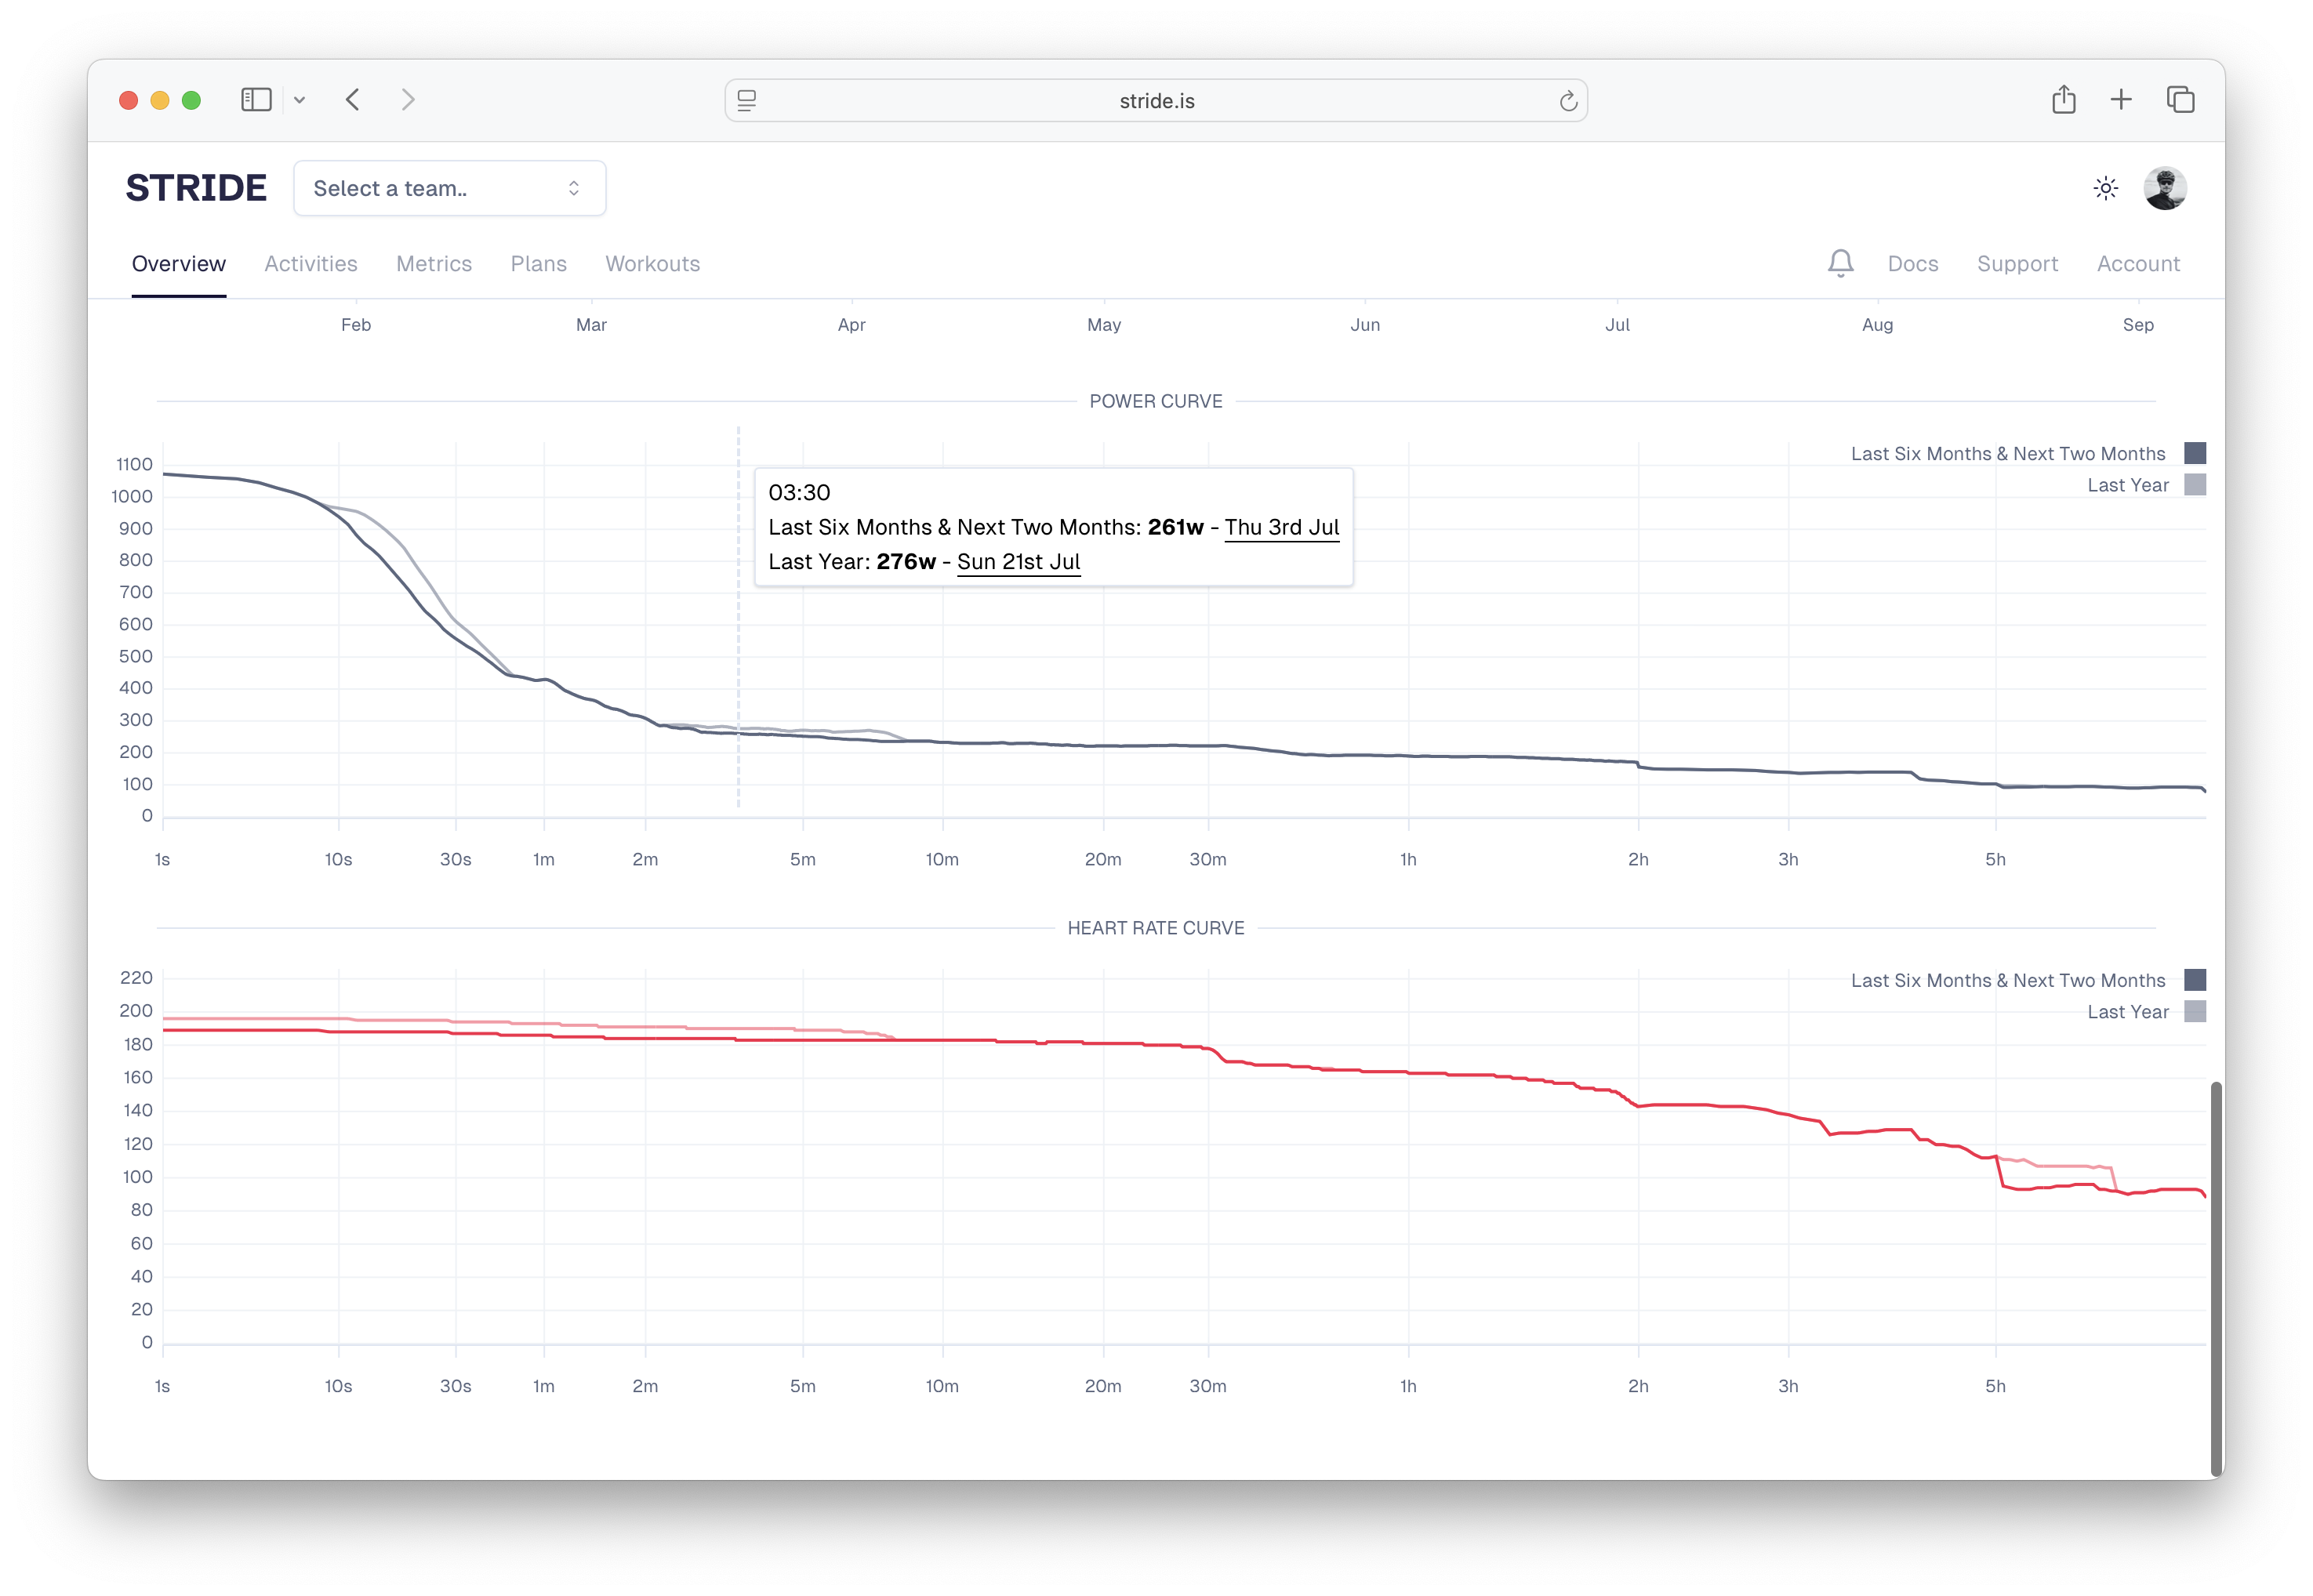
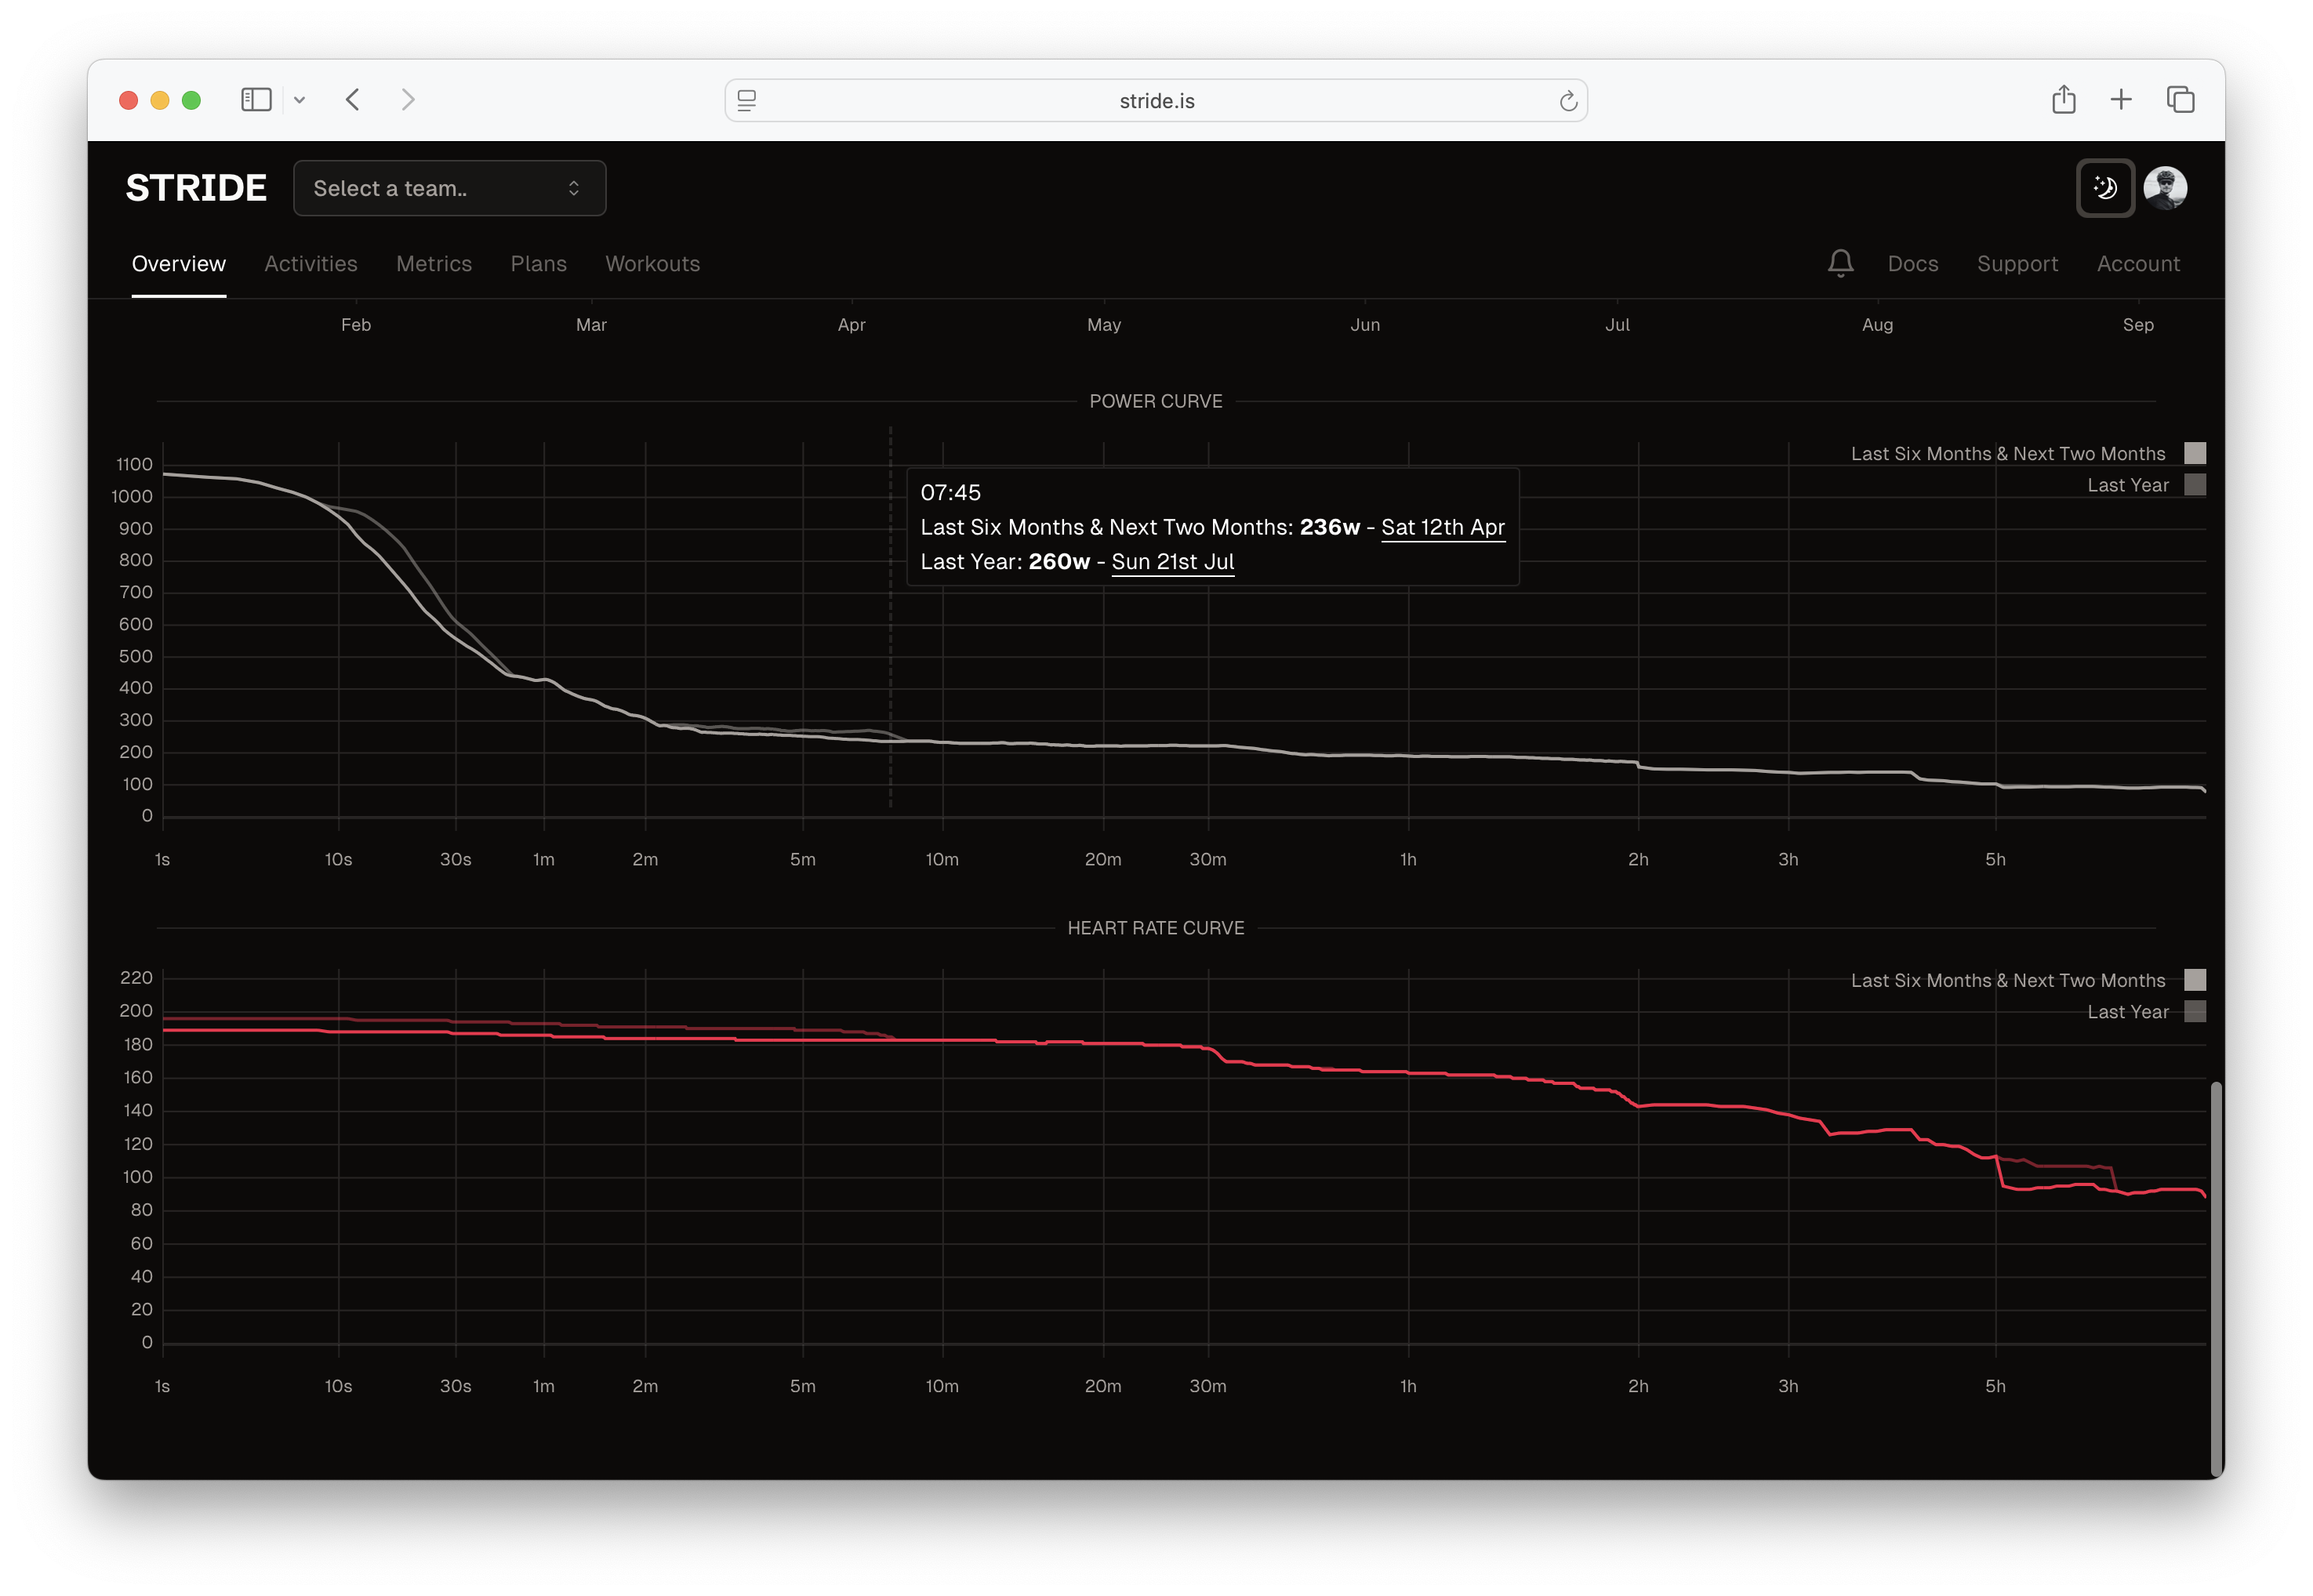
Power Curves
Your best efforts across all durations: Key Durations:- 5 seconds: Sprint power
- 1 minute: Anaerobic capacity
- 5 minutes: VO2 max efforts
- 20 minutes: Threshold power indicator
- 60 minutes: True threshold/FTP
Other Important Metrics
HRV (Heart Rate Variability)
Day-to-day variation indicates recovery status (synced from Whoop if connected).Efficiency Factor
Power divided by heart rate - shows fitness improvements when it increases for same effort.Using Metrics Together
The real power comes from understanding how metrics relate:- High Training Score + High Fatigue = Take a recovery day
- Increasing Load + Stable Fatigue = Good progressive training
- Power Curve Improvements = Training is working!
Remember: Metrics guide training decisions but always listen to your body. Feeling terrible with “good” numbers? Rest anyway.Think of it this way: A Training Score of 100 represents roughly the most you could do for 1 hour.